
Mass Diagram in Project Surveys | Construction & Characteristics
A mass diagram is an analytical tool used in excavation works in construction projects. It is used in construction projects, where the movement of the earth is required (earthworks).
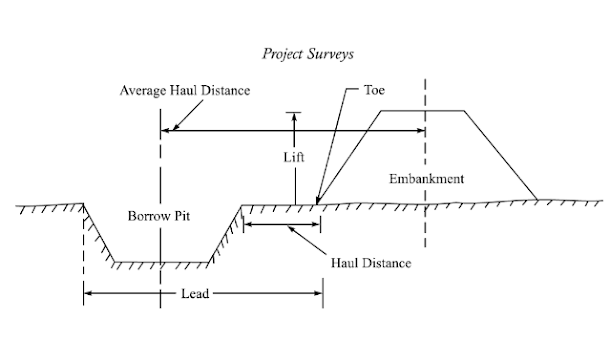
If we consider a natural terrain that needs to be converted into a level 1-1' for a particular highway project. For this, some portions of the terrain need cutting. While some portion demands filling. In certain situations, the earth from cutting is loaded to fill a depression or a dipping area as shown. This process is hauling.

- Cutting
- Loading
- Hauling
- Filling
What is Mass Diagram?
A mass diagram is a distribution curve that represents the distance of excavation work on the X-axis (abscissae) and the volume of earthwork on the Y-axis (ordinate).
The volume of cutting and filling is counted from the starting point to the point considered.
Mass diagram determines the average haul, free haul, and overhaul on a given segment of roadway.
- Haul: Haul includes the movement of material from the position of excavation to the disposal area or a specified location. It is also called an authorized haul. The distance that needs to be hauled is called hauling distance. In the figure, it is the distance between the nearest face of cutting to the toe of the embankment.
- Average Haul Distance: It is the distance between the center line (or center of gravity) of the cutting to the center line (or center of gravity) of filling (embankment).
Average Haul Distance - Free Haul Distance (F.H.D): A haul distance that is specified in the project rate of quantities is referred to as a free haul distance. This is the fixed price paid for excavating, hauling, and dumping material regardless of its length per meter cube.
- Overhaul Distance (O.H.D): Overhaul distance is the haul distance that comes after free haul distance. It is the haul distance beyond the free-haul distance for which extra charges are required for each cubic meter. It is represented by the station unit.
- Maximum Overhaul Distance: When the haul distance is large, more than the maximum overhaul distance, it is economical to waste the cut excavation materials and import fill from a convenient source rather than pay for overhauling.
- Limit of Economic Haul Distance (L.E.H.D): LEHD = F.H.D + Max O.H.D.

Construction of Mass Haul Diagram
1. Develop the longitudinal profile of the terrain, where the construction needs to be performed.
2. The dotted line represents the required level of road that needs to be achieved.
3. Calculate the cross-section area that needs to be cut or filled.
4. Calculate the volume of cut and fill of each section.
5. The volume of cut is considered positive and the volume of fill is plotted as negative.
6. Calculate the aggregate or cumulative volume of cut or fill.
7. In the same scale of the longitudinal cross-section of the land, a mass curve is drawn, with horizontal distance along the x-axis and Aggregated volume on Y-axis.
8. The corresponding point A, B, C,... N in the longitudinal profile is marked in the mass haul diagram as a,b,c,..n.

9. The point at which the curve crosses the baseline is q and p. This is marked as Q and P in the profile curve.
Characteristics of Mass Haul Curve

- The rising curve indicates cutting. (abcdef)
- The maximum point on the curve denotes the end of the cut or excavation called as maxima point. (point f)
- The falling curve indicates filling as the aggregated volume is decreasing. (f to j)
- The peak occurring at the end of a fill or embankment is called a minima point.
- The vertical difference between a maximum point and the following minimum point represents the filling of the embankment.
- The vertical difference between any two points not having a minimum or maximum between them, represent the volume of earthwork between them.
- If any horizontal line is drawn intersecting the curve, the volume of the cut equals the volume of fill between these points.
- When the horizontal balancing line intersects the curve, the area above the line indicates the volume needs to be shifted forwards (hauling is forward) (aq)and the area below the balancing line indicates the earthwork must be shifted backward (hauling is performed backward) (pq). These point of intersection of the mass curve with the balance line forms the balance points.
- The length of the balancing line between the intersection points represents the maximum hauling distance in that section.
- The area cut off by the balancing line represents the haul in that section. The haul is the volume multiplied by haul distance. From the graph, the area of the curve gives the haul.
0 Comments
Commenting Spam Links Are Against Policies